Explore why traditional CPU-based autoscaling fails Rails apps, and learn about more effective metrics like queue latency for timely scaling.
Key Insights on Rails Autoscaling
When dealing with synchronous web services, CPU and memory usage often serve as lagging indicators, creating a disconnect between application performance and infrastructure management. In scenarios characterized by higher traffic, user experience takes precedence, and relying on these traditional metrics can lead to application timeouts and errors. This situation becomes particularly critical in environments such as Rails, which requires nuanced approaches to scaling.
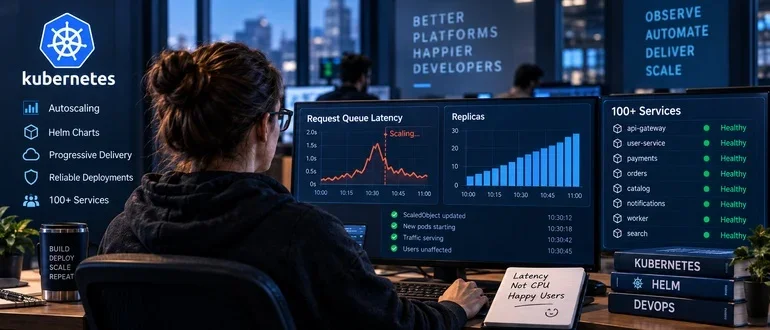
To address this issue, a focus on queue latency can provide a more immediate scaling signal. Rather than measuring how many requests are waiting, understanding how long requests are queueing provides actionable insights that prevent user impact. As Rails apps often operate under heavy loads, traffic spikes can easily overwhelm available resources, making it essential to deploy smarter scaling strategies.
Redefining Scaling Metrics
Queue latency is defined as the length of time a request sits in line, waiting for processing. This contrasts sharply with the concept of queue depth, which tracks the number of tasks waiting to be executed. For synchronous workloads, particularly in request-serving environments, latency serves as a first line of defense against performance degradation, whereas depth is better suited for background processing tasks where delays are less immediate.
This concept extends beyond Rails applications. Many systems face similar challenges where delayed responses lead to user frustration, and anticipating those needs becomes vital. For instance, an application serving requests might not reflect increased CPU usage until it's too late. By then, users may already be experiencing timeouts before any scaling adjustments can take effect.
Practical Implementation with KEDA
To effectively implement a latency-based autoscaling strategy, platforms like KEDA (Kubernetes Event Driven Autoscaling) can be leveraged. KEDA allows scaling based on external metrics, making it possible to react to latency spikes in real time. Setting up an autoscaler that monitors queue latency means deploying a system that adjusts capacity dynamically as user demands fluctuate.
For an effective setup, consider the following steps:
- Emit queue latency from your application: Modify your app to accurately report the time requests wait in the queue.
- Expose queue latency as an external metric: Integrate this metric into KEDA, allowing it to track latency and trigger scaling events.
- Set fallback values: In the event of metric fetch failures, establishing a safe replica count prevents applications from becoming unresponsive when scaling down is needed.
Handling Background Workers
When it comes to background processing, utilizing queue depth metrics offers a distinct advantage. For systems employing Sidekiq or similar background job processors, the ability to monitor task accumulation allows for managing backlog effectively. The goal here is controlling how many jobs are pending rather than responding to immediate user waits, highlighting a fundamental difference in how autoscaling should be approached between web-serving and background-processing environments.
Deploying Risk-Aware Strategies
Deployment processes also benefit from careful consideration. Every change presents an opportunity for unforeseen issues, such as auth failures or configuration mishaps. By adopting progressive delivery methods, like canary releases or blue/green deployments, teams can prevent disruptions by limiting traffic exposure until a new version proves stable under real-world conditions.
In addition, incorporating lifecycle management through preStop hooks can safeguard against disruptions during pod transitions, allowing services to drain connections gracefully and ensuring ongoing user accessibility.
Standardizing Helm Charts for Safety
Utilizing Helm charts offers a consolidated way to enforce best practices across multiple deployments. By embedding standardized settings like Pod Disruption Budgets (PDBs), liveness probes, and autoscaling rules into the charts, teams can ensure safe operational defaults. This strategy drastically reduces reliance on individual team knowledge and promotes a unified approach to deployment across the board.
Consolidating Signals Across Teams
With upwards of 100 services, establishing a consistent approach to both scaling and ownership across deployments resolves confusion and miscommunication among teams. Automatic observability through built-in labels and clear ownership helps teams maintain accountability and reduces the noise when incident resolution is necessary.
The commendable takeaway is to make default deployment strategies robust enough to ensure functionality without necessitating human intervention for every nuance. This entails focusing on future scenarios where downtime could occur, with safeguards that prioritize user experience and operational integrity.
Infrastructure platforms aren't just about the tools; they're fundamentally about simplifying decision-making processes. Providing clear, predefined paths and parameters for developers minimizes the likelihood of error, particularly in complex environments where multiple services and configurations intersect.
In the growing landscape of cloud-native applications, employing smarter autoscaling metrics and prioritizing user impact leads to better experiences and more resilient applications. With it, teams can work towards assurance that deployments remain stable and responsive, fostering longevity in both functionality and user satisfaction.
Discussion
Sign in to join the discussion.