A K3s platform uses Prometheus metrics and temporary diagnostics to detect incidents while avoiding centralized collection of application logs.
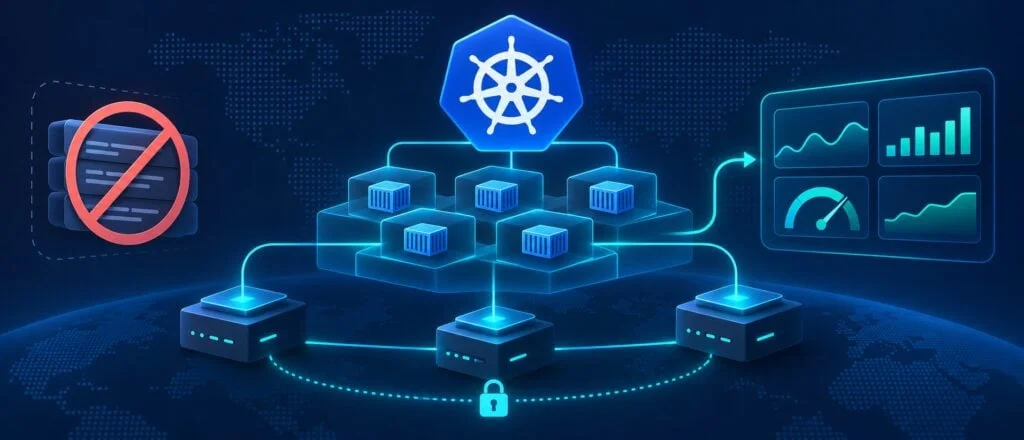
A production Kubernetes platform can retain useful operational visibility without building a central archive of application logs. That’s the practical claim behind a K3s deployment running more than 15 microservices across VPS nodes, where Prometheus metrics carry routine observability and verbose logs are enabled only for targeted investigations.
The design reflects a specific privacy choice: don’t collect user information in a centralized logging system and rely on deletion schedules to remove it later. That distinction shifts the work earlier in the pipeline. Teams must decide what telemetry they need, shape it before storage, and accept that an unanticipated question may have no historical log trail to answer.
The cluster spans VPS servers in different locations, connected over a private WireGuard network. Ansible can bring a bare VPS into the cluster in minutes without manual setup. The infrastructure is conventional; the unusual part is the absence of centralized application log collection, forwarding, and archiving.

Metrics define the routine view
Applications expose technical measurements such as latency, load, queue depth, and error rates. Prometheus scrapes those metrics, while relabeling rules discard label names outside an explicit allowlist before samples enter storage. The application configuration keeps only the metric name and selected operational labels:
metric_relabel_configs:
  - action: labelkeep
    regex: __name__|job|instance|service|route|method|code|le|quantile
The inclusion of __name__ matters: at this stage, Prometheus represents a metric’s name as a label. Drop it, and the samples lose the name needed to identify the metric.
This rule limits what gets stored, but it does not stop Prometheus from receiving every label produced during a scrape. Metric relabeling happens afterward. The application’s instrumentation therefore still needs to avoid exposing sensitive values in the first place.
There’s another gap in an allowlist based on label names: it cannot check whether a value contains private information. The platform addresses one concrete risk through code review. A route label must use a template such as /users/:id, rather than the raw request path, which could include a user-specific identifier.
Infrastructure metrics retain operational labels such as pod and namespace, while application series follow the narrower configuration. Alerts use those same measurements to identify user-visible problems, including high route latency or work queues that have stopped progressing. The operator reports that this has been enough for routine alerting without a log archive.
Investigations start with symptoms
The absence of searchable historical logs changes the first moves during an incident. Instead of searching a central system with grep, the operator uses high-resolution metric series to narrow the problem to a service and a particular behavior. In this deployment, that typically takes minutes.
When metrics don’t explain the failure, the operator turns on verbose logging for the affected service. The procedure is deliberately scoped: change the deployment’s LOG_LEVEL variable, reproduce the problem, inspect the live output with kubectl logs -f, then roll back the change.
That process is a diagnostic escape hatch, not a guarantee that no log line ever exists. Container output is captured locally by the runtime and can be read through Kubernetes. Nodes apply their own log rotation and cleanup behavior, and rolling back a deployment does not itself erase every local log file immediately. Journald on each node uses volatile storage.
That distinction matters when describing the architecture accurately. It has no centralized pipeline that collects and retains application logs, but temporary and local output remains possible. The privacy boundary is about avoiding routine aggregation into a searchable central store, not claiming that diagnostic text is never generated.
A review followed the actual data paths
An external engineer assessed the system by tracing its operation, rather than relying on architecture diagrams. The review followed a VPS from its initial state to cluster membership, examined traffic across the WireGuard network, and checked traffic originating from the nodes. It also looked for differences between the documented design and the running platform.
The reviewer had raised the possibility that incident visibility could have blind spots. The telemetry observed matched the Prometheus scraping configuration: metric series carried the allowed labels, and the reviewer found no separate centralized log-forwarding pipeline. That provides evidence about the inspected system and its traffic; it doesn’t remove the need to keep checking configurations as services and infrastructure change.
The trade is preparation for less historical detail
A metrics-first approach works best when teams can anticipate the signals they’ll need. Without stored logs, an engineer can’t return later to inspect a sequence of events that the metrics never captured. Instrumentation and alert design take on more weight, and debugging requires a clear process for enabling, using, and disabling verbose output.
That temporary setting needs attention. If verbose logging stays enabled after an investigation, the service can accumulate information the design sought to keep out of centralized storage. A one-line configuration change makes the mode easy to activate, but discipline is what makes it temporary.
The model also doesn’t meet every operational need. Teams that must produce an immutable audit trail need a purpose-built audit pipeline. A metrics-only monitoring strategy cannot supply that record, and it shouldn’t be treated as a substitute.
For teams seeking to reduce routine data collection, the architecture offers a different starting point from “collect first, manage retention later.” Prometheus provides measurements for service health; K3s, Ansible, and WireGuard support a distributed platform; and targeted live logs remain available for investigations. The cost is less historical context when an unforeseen question arises.
My read is that the practical lesson lies in the boundary the team chose: observability can describe system behavior without retaining every application event, provided instrumentation is designed carefully and diagnostic logging is controlled. As cloud-native monitoring tools make detailed metrics easier to operate, teams can make that choice deliberately—then keep reviewing what their telemetry actually receives and stores.
Discussion
Sign in to join the discussion.